Let's Get Nerdy: Visualizing the Impacts of Rezoning for Housing
Using data to see exactly how not-big-of-a-deal this rezoning plan is.
by Willem Klumpenhouwer
I’ve had a nagging thought over the past few weeks about the conversation surrounding Rezoning for Housing, the City’s plan to change the baseline zone from one that only includes single-family homes (and some duplexes) to one that allows for up to 4 row-houses.
The feeling that I can’t shake is that despite the attention this zoning change is receiving, rezoning is really not a big deal in terms of the overall impact to our city.
And yet the way many people are reacting reminds me of Sally Brown’s reaction to the start of another school year:
I think one of the big misconceptions is that the change brought on by citywide rezoning will be huge. People talk about entire communities changing overnight. But by all measures the impacts of these changes are going to be small, incremental, and spread over much of the city.
So as I do most times when I’m looking for a better way to understand or see something on a large scale like this, I turned to the data.
Here’s what we’re going to do: We’re going to simulate 10 years of expected change from rezoning the entire city to allow rowhouses, and explore what that change actually looks like.
We’re talking about cute rowhouses
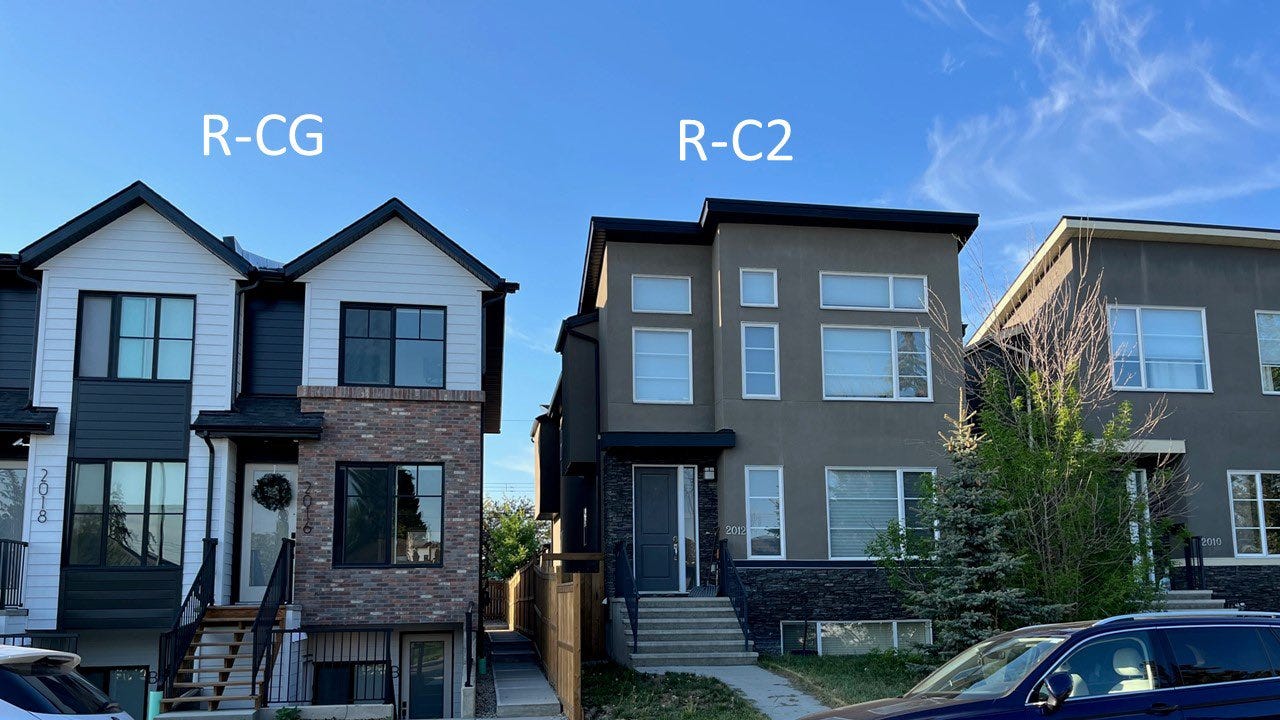
Before we go on, though, I think it’s important to have a mental picture of what I will be referring to as a “cute rowhouse” for the rest of the article actually looks like. Buildings that are built on R-CG zoned land tend to look a lot like the ones on the left of the photo below:

As we get into the data and look at maps of change, keep in mind that this is the type of bulding R-CG allows.
Not 16-storey apartments, not even 3-storey apartments. Every unit has a front door to the street (G stands for “grade”), and the buildings fit in with existing building types (C stands for “contextual”).
Okay - to the data.
Rezoning removes one (of many) costly steps
The idea of rezoning the city is to remove one barrier in the process of building a set of four of those cute rowhouses pictured above. Right now, a land owner needs to go to city council and ask them to change their specific lot to R-CG. This requires significant staff time, council time, and time and effort by the land owner.
And the result? About 95% of the time council gives a thumbs up.
After rezoning, the land owner still needs to submit plans and a bunch of other paperwork to the city to get permission to build. This is called a development permit, and the process for that is not going away. There are still checks and balances to make sure that the building built on the land matches what the land use promises.
The goal of rezoning is to remove the costly step of changing what’s allowed on your land. As a result, it becomes a bit cheaper to build those types of houses. And because of that you might expect to see more of these types of homes as they are in pretty high demand.
The city estimates that over the course of 3-4 years we will go from seeing 150 of these lots change up to about 500 before levelling off:
Over 10 years, that’s about 3,900 lots changing to cute rowhouses. If each of these lots are single detached homes (they probably wont’ all be) and the owner builds four units (they probably won’t all do that), that’s11,700 new neighbours Calgary can accomodate. If each of these four units comes with a basement suite built in (they definitely won’t all do that), that’s 23,400 new neighbours Calgary can accommodate. My guess is probably half that. It’s not a huge number, but it’s one piece of the multi-piece housing puzzle we are trying to solve.
So we have our total numbers. The next question is where will these conversions happen?
Not all neighbourhoods are equally attractive
If we look at where existing non-city-led R-CG rezonings happen, we can see that they are not evenly distributed across the city:
Based on this map and some basic assumptions about what makes an area attractive to rowhouse-type living, I constructed a point system to score each single detached and duplex lot in the city based on the following measurements:
Age of the community (10 points possible) - based on relative amounts of existing rowhouses built
1950s: 10 points
1960s/70s: 5 points
1980s/90s: 4 points
2000s: 3 points
Building Out: 1 point
Inner City: 8 points
Number of jobs accessible by transit in a reasonable travel time, ranging from 0 points (none) to 5 points (highest)
Straight line distance from the lot to the Calgary tower (up to 10 points)
Astute observers might comment that most of these things are correlated: The closer you are to the centre of the city, the better your transit access, and the older your community. That’s absolutely true, and it speaks to the importance of urban communities getting more neighbours. It also follows pretty intuitive economic assumptions about where people want to live if cost of housing wasn’t a factor.
Here’s how all the single detached and duplex homes score on my “rowhouse attractiveness” scale. Dark blue is low (0 points), bright yellow is high (up to 25 points). Blank areas are areas either with no low-density homes (e.g. downtown), or no homes at all (e.g. industrial areas).
Okay. That’s a good map. But one thing it doesn’t tell us is how big the pool of potential lots is. And it doesn’t give us a visual of what neighbourhoods might look like over change.
That’s where the simulation comes in. Using the scores I developed as weights, I randomly selected lots throughout the city for each year after the rezoning change (so 150 in the first year, 300 in the second, etc.) and “converted” them to rowhouses. I then removed those from the pool of possible houses and did the same thing for the next year, and the year after.
This way I can keep track of which lots changed, and which ones didn’t. This makes for a great way to see just how much of a community might change.
After 10 years, here’s what an attractive inner-city community might look like:

And here’s what it looks like in the suburban area of Shawnessy:

My first impression is: Wow, that’s not a lot of purple dots over a given area. And my second impression is that especially if you live in a suburban area like Shawnessy, you very likely won’t even be able to see a rowhouse from your house. Which in my opinion is a shame, but really speaks to the minimal impact of this change.
Suburban councillors have nothing to lose but higher taxes
Let’s add up all the existing and converted rowhouses throughout each ward, as a percentage of the total number of lower density dwellings, and see what we get:
As you might expect, Wards 8 and 7 will see the highest number of cute rowhouses after 10 years. In fact, Ward 8 has about as high a rate of row houses as Wards 2 and 14 are projected to have, and even more than Ward 12.
And just to drive the point home, we are talking a maximum of 3.5% of what used to be single detached or duplex homes becoming rowhouses. For every 100 lots, that’s less than 4 that will be rowhouses.
Just to drive the point home, here’s the same chart scaled to 100%:
For all wards, but for suburban wards especially (1, 5, 3, 13, 2, 14, and 12) the impact is pretty much negligible. Which raises the question: why would some of these councillors be so opposed to this change?
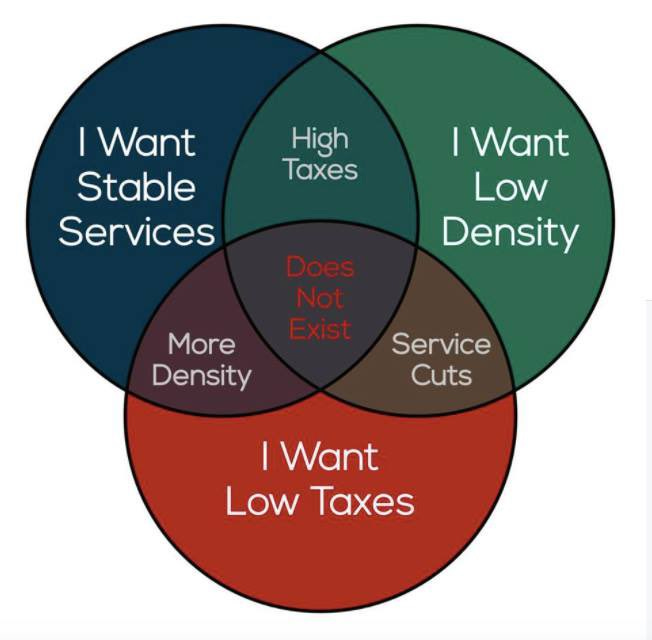
I ask this especially about the self proclaimed “fiscal hawks” who recently voted to cut the budget and therefore services, because there’s a fundamental law of cities they seem to be ignoring: Among the options of low taxes, low density, or stable services, you can only pick two:
With such a minimal impact to their wards, I wonder how councillors who oppose this change but support lowering taxes will reconcile that with their constituents.
If the change is so small, why do we bother?
It’s a good question: Why go through this process when the impact seems so small?
First, because every little bit helps. Mayor Gondek recently reminded us that 60 people move to Calgary every day - that’s 21,900 people a year. By the numbers qoted by City administration this R-CG change will cover about 7-10% of that influx, a small but important piece of that amount. Small changes can add up over time.
Second, because it simplifies the process. Call it red tape reduction, or streamlining processes - either way it means less council, staff, and builder time spent on something approved 19 times out of 20. That’s good for city governance, and it’s good for the taxpayer. When council spends less time on small one-lot applicaitons, they can focus on large concerns like affordable housing, planning policy, and budgets.
Third, because adding more homes within our existing city will help make services cheaper and more successful.
Visualization can help provide context, so please share!
If you’re a councillor and you’re reading this, feel free to share these maps with your communities. If you want one for your ward in particular, I’d be happy to make one for you, just send me an email at info@moreneighbourscalgary.ca.
If you’re an advocate or a community association board member or really any interested Calgarian, pass this along to a friend or family member.
Thank you for reading!


Very cool! I like the article, it's great and nicely summarizes things!
Thank you for doing the labour intensive work to visualize the impact and explain things. Extra respect for giving detailed answers to the question comments!